
This short article reviews unique strengths and areas to be aware of when using SenseMaker for development research. SenseMaker is a research tool designed for social complexity. It fits a unique niche. Firstly, its indicators are easily visualized and dis-aggregated which makes it ideal for pragmatic development needs. Secondly, answers to questions emerge from peoples’ experiences which increases trustworthiness of the data. Thirdly, it asks questions in such a way that causes people to answer based on complexity science principles – making it ideal for thought leadership.
Nine months ago, I embarked on a journey to understand resilience with my colleagues. SenseMaker was our guide for this journey. The journey has been as much about learning a new way to research complexity (SenseMaker) as it has been about understanding what it means to be resilient. For this project I worked in Timor-Leste, Bangladesh and Indonesia.
Setting the Scene. The interview process with SenseMaker starts asking participants to tell a story of one of their life experiences that relates to the topic of inquiry. This is called the prompt question. Their stories are snapshots of their experience and are called Micro-Narratives. The facilitator creates an atmosphere for people to tell a story that feels like they are talking to family or friend. The rest of the framework asks questions back to this narrative. The remainder of the questions are typically not linear; participants compare numerous concepts in relation to the original story. Participants signify their narratives.
SenseMaker Uniqueness
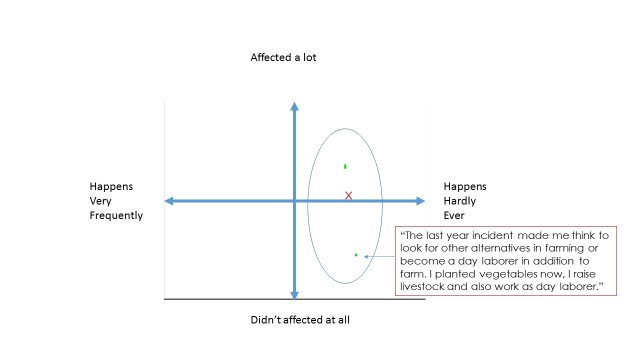
Explore Positive Deviance. SenseMaker highlights what the minority of respondents choose as well as the majority respond. The signifier below – (in standard research called a question) is called a “field with stones”. Participants are asked to identify where they find themselves on an X – Y axis; to do this, they use an image on a tablet (figure 1).
Researchers asked participants how heavily hazards in their narratives effected them and how often it happened. Figure 1 represents the impact of strong winds in western Timor (Indonesia) on people who also said they progressed even though they faced a hazard. Overall 113 of the participants said they were impacted by strong wind (not shown here). To find positive deviance, the data was dis-aggregated by those who in another part of the study said they had progressed even though they faced the hazard (only 3 participants from the 113). In traditional research, these three would be lost through a focus on the majority response. However, we were able to look into their narratives for positive deviance. Figure one shows just one of the emergent ideas -diversify income source- that came from the narratives.
Increased Efficiency. SenseMaker uses different kinds of visual devices to ask questions. One of these is called a “slider with stones”. Traditional survey approaches would take much more time to gain the same information derived from this method. For example, it took 2 minuets to answer questions for figure 3 using SenseMaker where traditional methods might take 8-12 minutes.
Slider with stones generates two pieces of data at the same time:
- how valuable an item is over another item.
- the value the given item has on a scale.
Figure 3 shows a “slider with stones”. Researchers showed the image to participants on a tablet. Participants identified the action they used to overcome the hazard in their narrative. They pressed all that applied. The participants then identified if the item they chose had positive results or negative results.
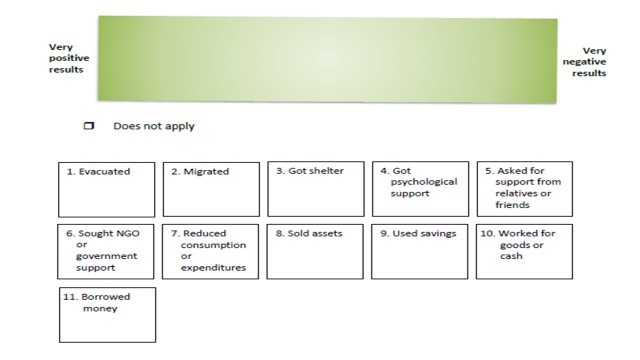
The example below shows the result for only two of the stones (9 used savings; 11 borrowed assets).
Savings. Few people used savings (8%). Those who saved found it to be positive. Of the people that used savings, 84% also identified themselves as resilient (blue) in another part of the study while 16% identified as vulnerable (red). By observing the average, it is easy to see the positive impact of using savings.
Borrowing. 34% of the overall population borrowed money. By observing the location of the average of those who borrowed money, you can observe vulnerable populations identified borrowing as a much more positive way to overcome the hazard than those who were resilient.
Figure 3 shows the question that took under 2 minutes to ask. This question generated 11 pieces of data that can be dis-aggregated by various multiple choice questions. For a similar method like Likert to gain these 11 pieces of data, it would require 11 questions.
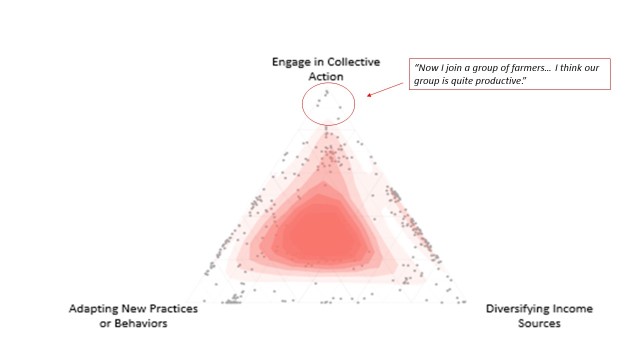
Ability to look into peoples’ narratives behind the signifiers (questions). One of the basic strengths behind SenseMaker is the ability to identify narratives behind signifiers in order to create context and increase depth of meaning. For example, the signifier below is called a triad. Participants were asked to identify relative strengths of different ways of adapting to the hazard in their story. They ranked between “engaging in collective action,” “adapting new practices” and “diversifying income”. Each dot represents a participant’s answer. In analysis, the researchers can select the dots they are interested in to explore any trends in the stories.
Quantifiable codes directly come from people’s experiences. SenseMaker centers around micro-narratives or life experience. Participants tell a story -as they would to their family or their friends- about the subject under inquiry. After telling the story they signify –self code- the story with questions to name complexity. Grounding the questions in a story counters many surveys or interviews that ask people to theorize without grounding the theory in personal experience.
What to be aware of:
Anticipate appropriate use of time. It is important to consider how many questions to ask during the design phase; also, it is important to carefully consider the framework’s complexity. Fewer questions with higher focus will create higher quality. Increased focus increases quality.
SenseMaker takes extra time to learn how to use. However, its use is similar to other methods and depends entirely on the design of the signification framework (i.e. questionnaires).
There are three factors to consider in relation to data collection:
- How long does it take on average to ask each kind of signifier.
- How many of these kinds of signifiers are asked.
- How far apart respondents live from one another.
Sample size based on need. There are two considerations to identify sample size: 1) quantifiable reliability and 2) the need for visualization. As part of the design process, the questions to ask are:
- Do you want the signifiers (indicators) that are quantifiable and can be generalized to a larger population? If so, follow standard statistical methods for choosing sample size.
- Do you want to identify emergent trends in various groupings based on beaing able to visualize the data? In this case the rule of thumb that SenseMaker consultants go by is 80-100 respondents per group you are interested to understand (even this number depends on use and population under study).
Ensure complexity of your signification framework is appropriate for the context. SenseMaker can be as simple or complex as you want. Ensure you design the framework to align with the level of data collectors.
- If data collectors are not used to narrative data, invest in training them to collect narratives.
- Consider training data collectors not only in the use of the tablet but community participation techniques using paper, stones and string to increase accuracy.
- Ensure information on the tablet is simple and understandable. As much as possible, resist the temptation to add extra information with sheets of paper that might confuse the process.
Use of the Narrative is specific to the question. The use of the narratives is: 1) to ground quantifiable questions in context. Participants answer questions from a their experience; 2) to place the signifiers within a context. Quotes are powerful to identify emergence; 3) to create saturation and thick description around the prompt question but not necessarily around the signifers that follow.
Conclusion: As a researcher who has done numerous narrative projects and as a program manager, SenseMaker fits the beautiful tension of providing pragmatic -and usable- data and generating depth that can be used for thought leadership. It is powerful and can add the needed tool for understanding the complexity that is ever-present in development. I recommend its use for complex situations with the only recommendation of ensuring there is enough time for project teams to come up to speed on its uniqueness in its initial use.
Note: This article does not reflect the views of the author’s employer. Although the opinions in the article are purely that of the author, the research process described above has come from many discussions with a larger team. Of specific note Mohit Holmesheoran turned an interesting image into a telling graphic by creating the heat map of the triad.

Hi, interesting project with interesting results. It reminds me of a project we did a few years ago on food-security for ultra-poor women in Bangladesh. Although we use and used other tools that are more open-source based, in general your experiences seems to match ours.
In particular however I was surprised to see the patterns of responses in the tripolar (what you call a triad) in Figure 2. It seems to me the far majority of respondents has placed their answer on the boundaries (lines) avoiding the middle.
In the mentioned project we found strong evidence that this answering pattern is heavily influenced culturally. Marginalized people in some cultures, including your respondents in Bangladesh, don’t feel they can use the space available and opt to place a dot on the lines. They don’t feel empowered to use open spaces …..
So in fact instead of a tripolar you might have presented your respondents with a triangular line or maybe 3 lines between the poles. Not sure if these are dipolars or scales for the respondents but to me it seems you have applied another instrument than you thought you did :-).
We have found multiple of these kind of issues with both tripolars (triads) and dipolars( dyads) over the years AND we found some strong positive results when certain rules for question/ pole dynamics are taken in account. We have learned the hard way that using these instruments is far from easy. If you want to learn more regarding this kind of challenges in Narrative Sensemaking (or Participatory Narrative Inquiry) as we call it now, please feel welcome at http://www.pni2.org and/or the monthly PNI Institute zoom calls where we strive to improve our practices with a group of active PNI/Sensemaking/drama practitioners.
LikeLike
Harold! Love the amount of thought you put into your reply. In attempting to make the article an easier read I light have left a few pieces out. Also I left out analysis / interpretation from this article as I was reviewing the methodology. Sorry I was not clearer. The triad you are referring to is from the Indonesia data set. Also the visualization is a heat map. The highest density is in the middle rather than the sides. The high density being in the middle actually can cause some issues in analysis. It is difficult to say what it really means when it signifies in this way. However we de-segregated the data by levels of vulnerability which dos end up helping us in analysis. Your point about cultural interpretation of filling in space or not is well taken. I will xonsider this with the Bangladesh data. Thanks much. I looked at the website you mentioned looks like you have a strong background in narrative reasearch. Very interesting stuff! Thanks again!
LikeLike
Does that mean that there are dots/stories in the centre of the triangle? They ae not visible on the figure.
LikeLike
Hi Matt and Harold,
related to the triad, I think finally we figured out during the resilience study a good way to facilitate it in order to get a result more proxy to the perception of the participant and not a type of “rule of thumb estimate” what seemed to happen in a lot of cases. After facilitating in several cultural contexts, I think it depends also a lot on how you facilitate the tools.
Thank´s Matt for the article.
LikeLike
Yes the redder the image the more dots.
LikeLike
Is this the Cognitive Edge SenseMaker tool? I haven’t seen the slider with stones before.
LikeLike
Yes It is and I think that
LikeLike
Sorry it posted befor I wanted it to. Yes it is cognitive edge. I think the slider with stones is newer. It is basically a field with stones without the y axis.
LikeLike
Thanks – interesting
LikeLike
Thanks a lot Matt for sharing our study, and for your thoughtful insights about the SenseMaker methodology. I enjoyed reading it!
Catholic Relief Services started piloting SenseMaker in 2015 and we introduced the slider with stones because we felt that having the two axis is not a must, and also it makes using stones easier. So I will recommend to use the Stones with the two axis only if it is really necessary.
Harold: Thanks for letting us realized that presenting the triad with the heat map may mislead the interpretation of results. This is very important to properly communicate our results.
LikeLike
Veronica! Great to see you got read the article and engaged in the comments! Thank you! Also I appreciate the background on the slider with stones I did not know that was a CRS innovation. Well done!
LikeLike